Old BRAD vs New BRAD
Smarter Insights, Better Decisions, and Greater Impact
As environmental regulations tighten, and corporate sustainability goals grow more ambitious, effective waste management has never been more important. That’s why Bywaters introduced its new Reporting Analytics Dashboard (BRAD) – an upgraded, smarter, and more intuitive platform designed to simplify waste data management.
Built with our clients’ feedback at its core, BRAD delivers real-time insights and enhanced functionality, making data-driven sustainability decisions easier than ever. With a modernised interface and powerful new tools, it’s now one of the most user-friendly reporting solutions in the industry, and we remain committed to continuous improvement.
Improved UX & UI | ||||
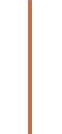
Old BRAD had a basic, light-coloured interface with minimal contrast. Navigation and data presentation were not fully optimised for quick decision-making and lacked intuitive design elements. |  | The updated dashboard features a modern dark/light-mode interface, with better contrast for readability. Navigation is streamlined, so now you can access key data with just a few clicks. An optimised page structure with interactive visuals and a responsive layout will make interpreting information faster and easier.
| ||
Key Performance Indicators (KPIs) | ||||
The old dashboard had limited KPIs such as total waste, recycling rates, and CO2 savings. |
| Has 10 KPIs, centralized in the easy-to-read widgets. On top of the basic KPIs, now you can get insights into the number of trees saved, CO2 emissions generated by our services while processing your waste and more.
| ||
Waste tracking and categorisation | ||||
Waste types were listed on a dashboard in a text-based table, making it difficult to compare different waste streams at a glance. |
| BRAD has a detailed pie chart that displays waste type percentages, and an advanced filtering tool to make it easier to see how waste is distributed across different categories of waste type.
| ||
Leaderboard | ||||
Old BRAD did not have a clear benchmarking tool; you had to manually compare different site performances. |
| A new leaderboard highlights top-performing sites based on recycling rate, emissions reduction, and waste minimization, encouraging continuous improvement.
| ||
Trends visualisation | ||||
In the old BRAD data was presented primarily in tables or static bar charts. CO2 emissions were displayed as a single numerical value, with no visual representation of changes over time. |  | New BRAD has interactive line and bar graphs. You can now see how your businesses’ CO2 emissions have change over time. The graph will help you to easily identify spikes or reductions in emissions, providing visual material for internal or external use.
| ||
Advanced filters and multi-selection | ||||
Filters in the old BRAD were simple, allowing only single-option selections for waste type, location, and date. It required multiple searches to compare different datasets, and additional effort to save them in a final report. |
| New BRAD offers multi-selection filters for different accounts, waste type, sites, and date ranges, enabling you to analyse multiple criteria at once. The filters refine data instantly, making it easier to track trends. Additionally, now you can download filtered dashboards as a PDF report with just one click.
| ||
Transparency in job status and issues | ||||
BRAD primarily displayed job completion status but lacked detailed insights into service issues. Any failures or delays were marked with minimal explanation. |
| The job list now includes a ‘Job Issue Type’ column, specifying reasons for failed or incomplete jobs. It also indicates whether the issue affects the service rate, who was responsible for the issue, and whether it has been resolved, offering greater transparency into operational challenges.
| ||
Personalised improvement advice | ||||
With old BRAD you had to manually analyse data to identify areas for improvement, making strategy adjustments for waste reduction more time consuming. | | The new ‘Ways to Improve’ section provides personalised recommendations based on performance data for your business. It highlights actionable steps, such as increasing recycling efforts, optimizing collection schedules, or reducing incineration rates.
| ||
Centralised access | ||||
Documents were scattered across different sections, making searching for certain files time consuming and less efficient. |
| With our new dashboard you can access all essential documents from one centralised location. Now documents, reports, invoices, accreditations, and sustainability audits are all in one place, ensuring workflow and reducing the time spent searching for files. | ||
With the new improved BRAD you can now gain smarter insights, make better decisions, and achieve greater impact by optimising waste management, reducing costs, and enhancing your sustainability goals – all in one place. Experience the future of waste analytics and make even more sense of your big data!
Contact Bywaters today for more information about BRAD!
If you have an account already with the previous version of BRAD, you will need to create a new login for the latest version of BRAD. If you require access, please contact your account manager.
From global shifts in sustainability policies to local waste management crises and innovative digital audits, explore the complex challenges and solutions shaping our environment today. Discover how economic pressures, labor disputes, and technological advancements are impacting sustainability and waste management practices worldwide.
Read more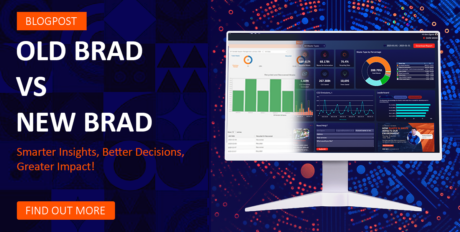
We are proud to introduce new and improved BRAD – our upgraded Reporting Analytics Dashboard built with the customers’ feedback at its core. Smarter, faster, and easier to use, the new BRAD offers smarter insights, better decisions, greater impact. Discover the all-new BRAD – make a step toward your sustainable goals!
Read more
On 18th March, we celebrate Global Recycling Day, highlighting the importance of reducing waste, conserving resources, and cutting carbon emissions. With over 2 billion tonnes of waste generated annually, recycling is more crucial than ever. Discover how Bywaters is leading the way in sustainability and how you can make a difference.
Read more