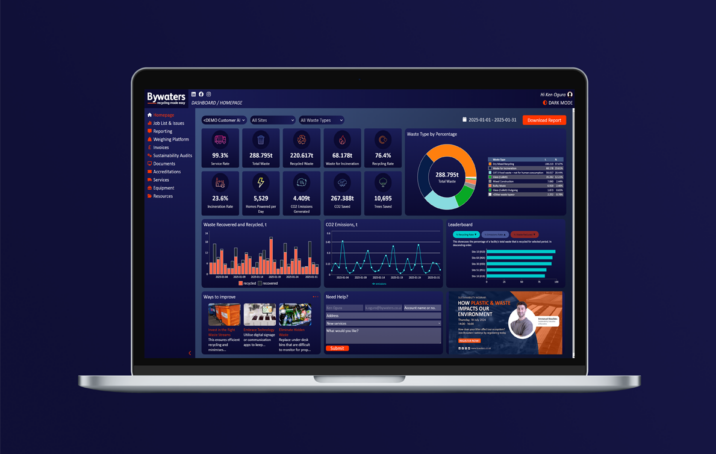
Making Sense of Big Data
BRAD, provides a comprehensive view of your waste management data. Available in dark and light mode, it makes your data easily intelligible through colour-coded graphs and clearly displayed KPIs, covering everything from recycling rates to CO2 savings. Brad also offers the use of practical filters, allowing the segmentation of waste data by Account, Site, Waste Stream, and Date. This enables you to easily narrow down your search and analyse specific data sets, such as glass recycling during a particular event.
BRAD’ design was based directly on client feedback, focusing on their need for accessible and insightful waste management data. This collaborative approach has yielded one of the industry’s most user-friendly reporting tools, and we’re committed to ongoing development.